Japanese Candlesticks: The Complete Guide for Quant Funded Traders
Japanese Candlesticks: The Complete Guide for Quant Funded Traders
Master the foundations of price action and candlestick psychology to level up your funded account performance.
In the world of Forex and CFD trading, few tools are as important—or as misunderstood—as Japanese candlesticks. Whether you're trading a Quant Funded Challenge, aiming to scale your funded account, or refining your intraday execution, understanding candlestick behavior is essential.
Candlestick patterns provide raw insight into market psychology, liquidity, and momentum, helping traders identify potential reversals, continuation patterns, and high-probability areas of interest.
What Are Japanese Candlesticks?
Japanese candlesticks originated in the 18th century at the rice exchanges of Osaka. Today, they are the global standard for displaying price movement across almost every financial market—including Forex, indices, metals, and crypto.
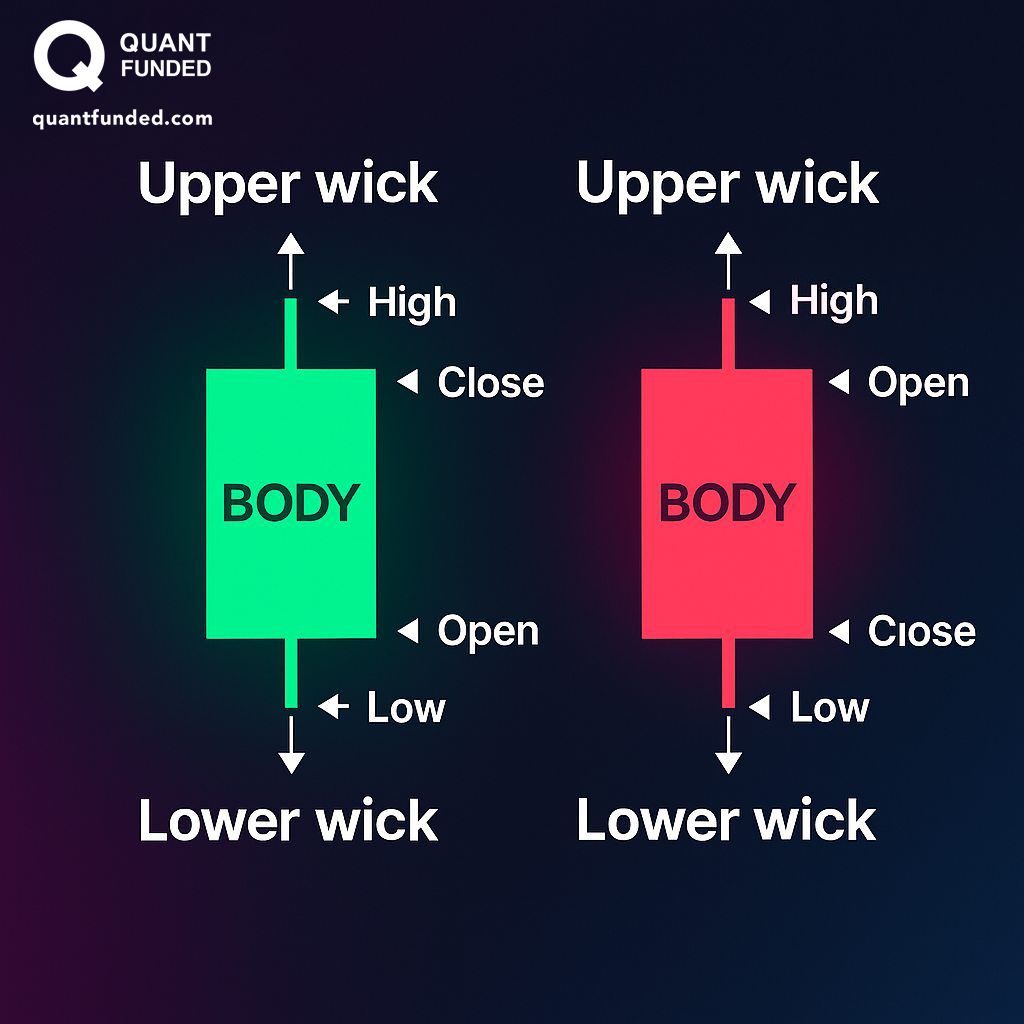
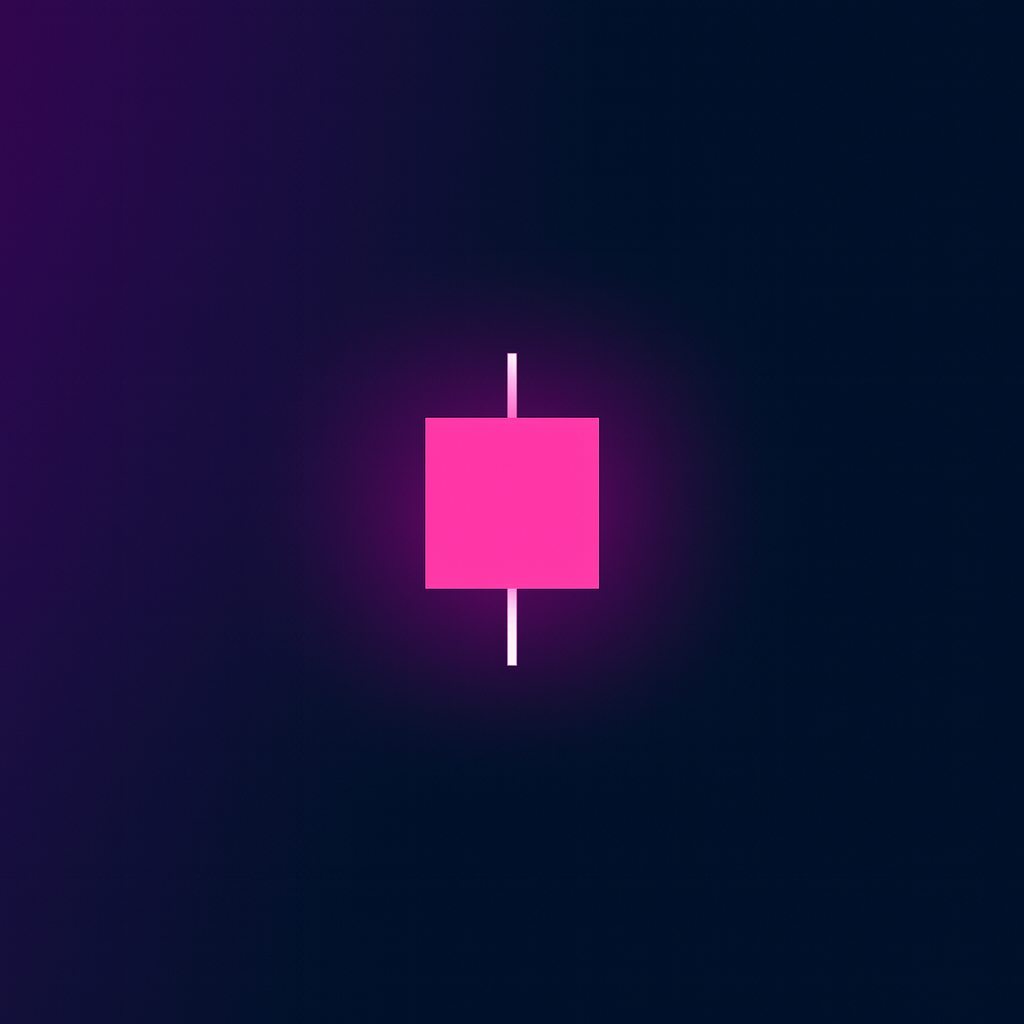
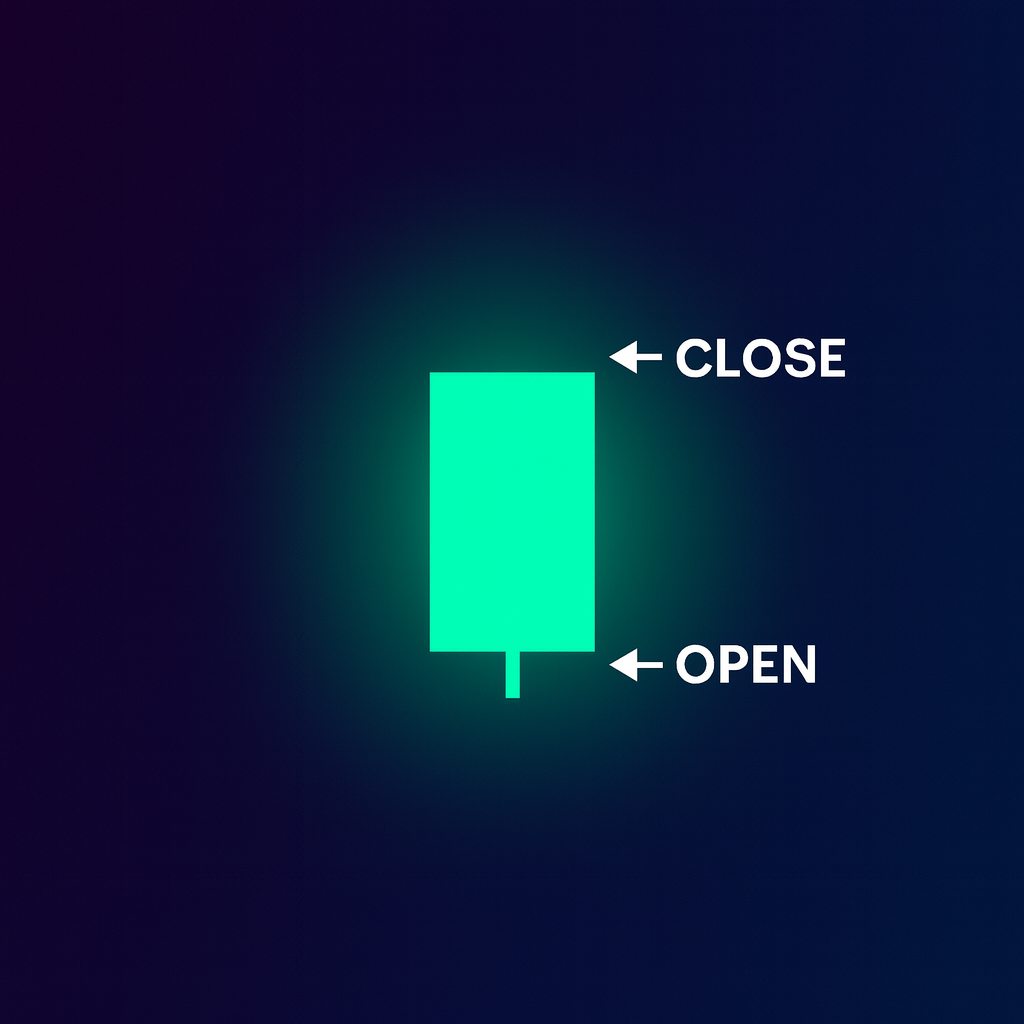
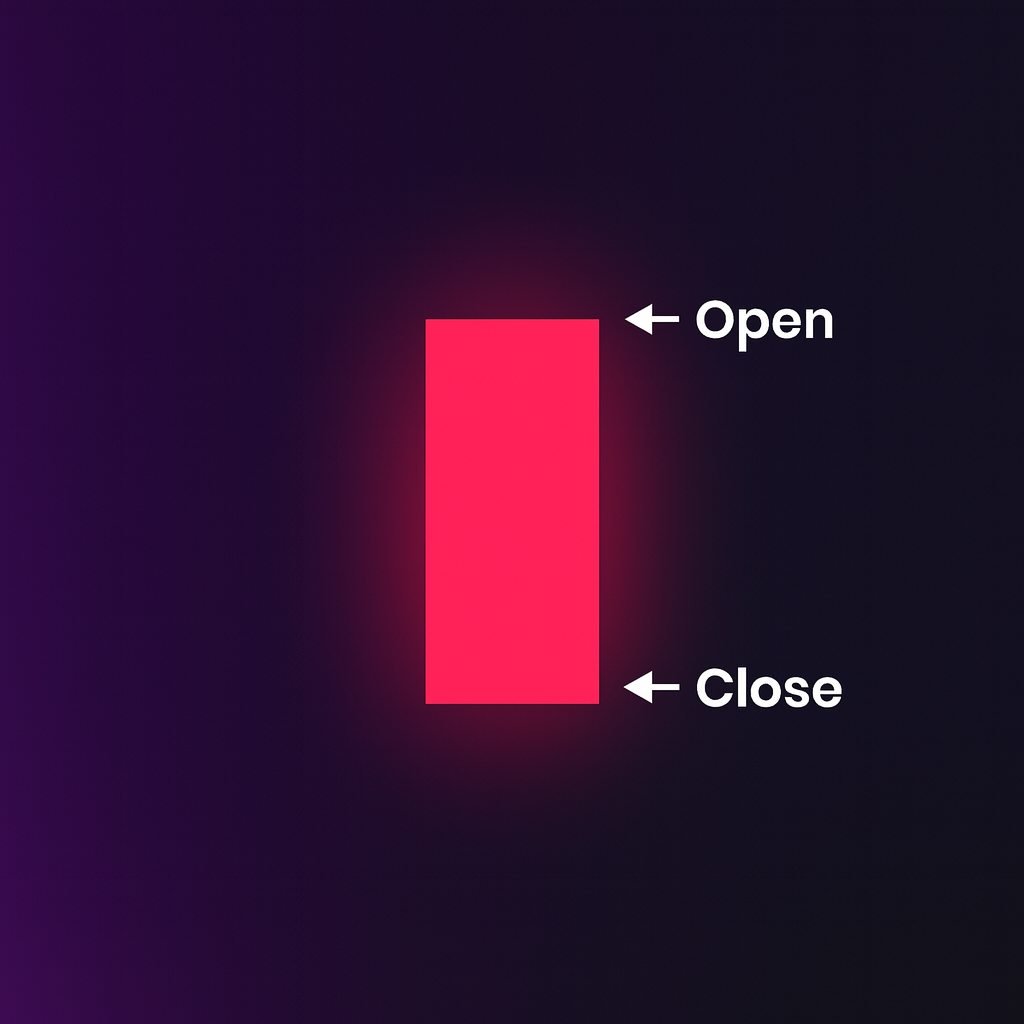
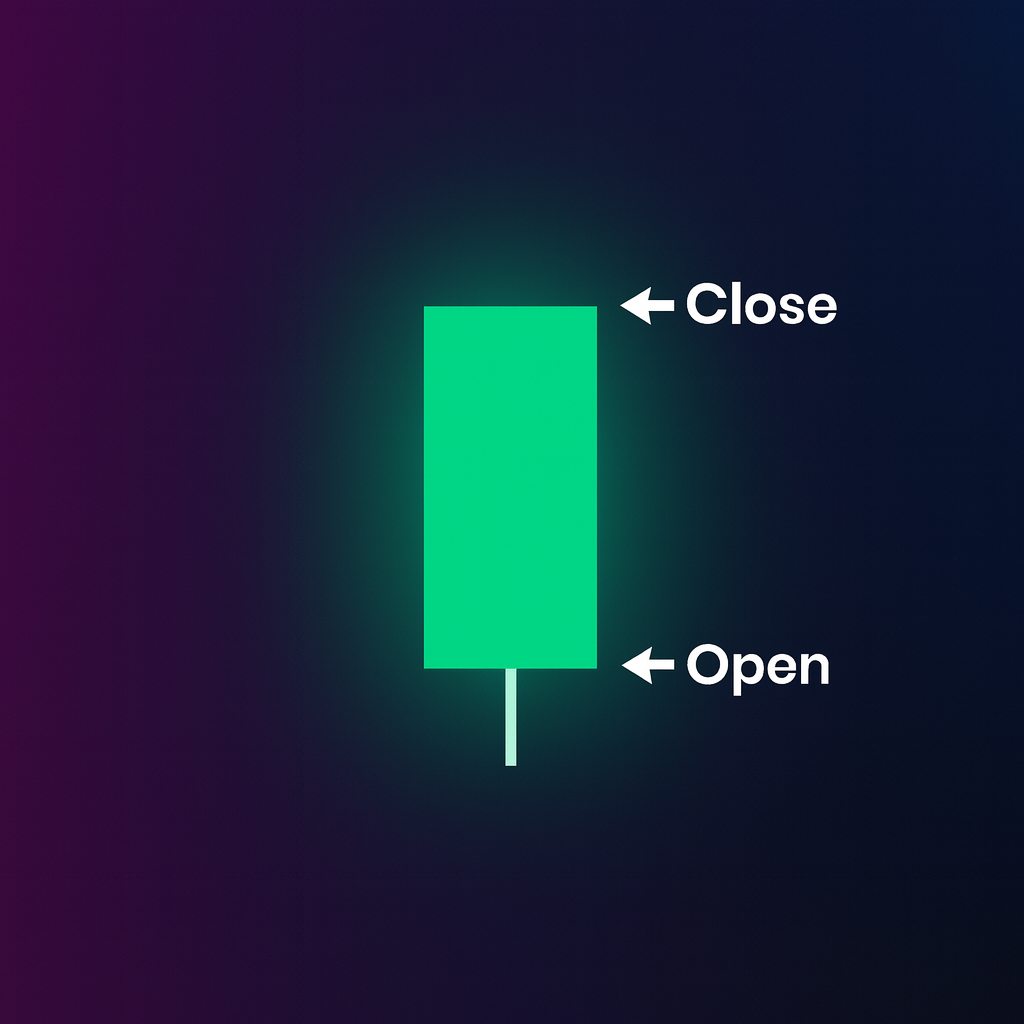
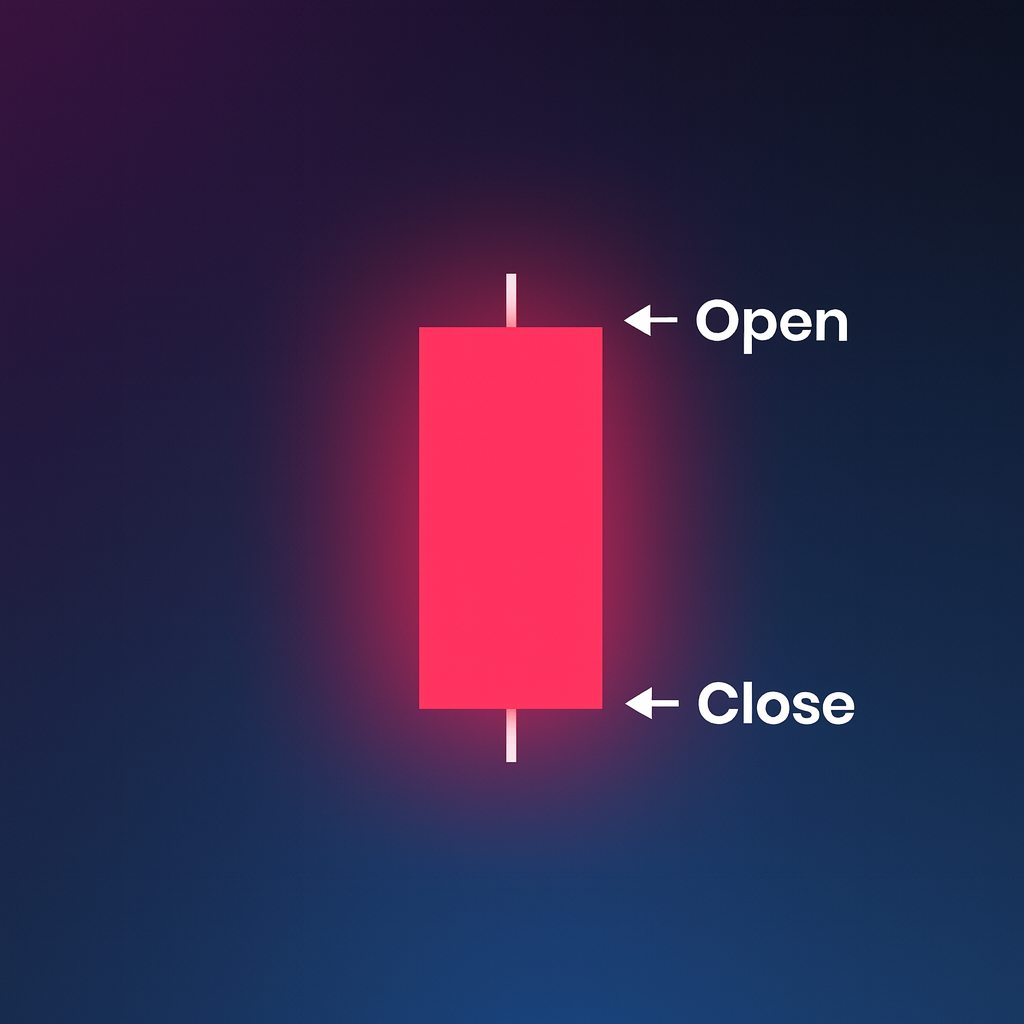
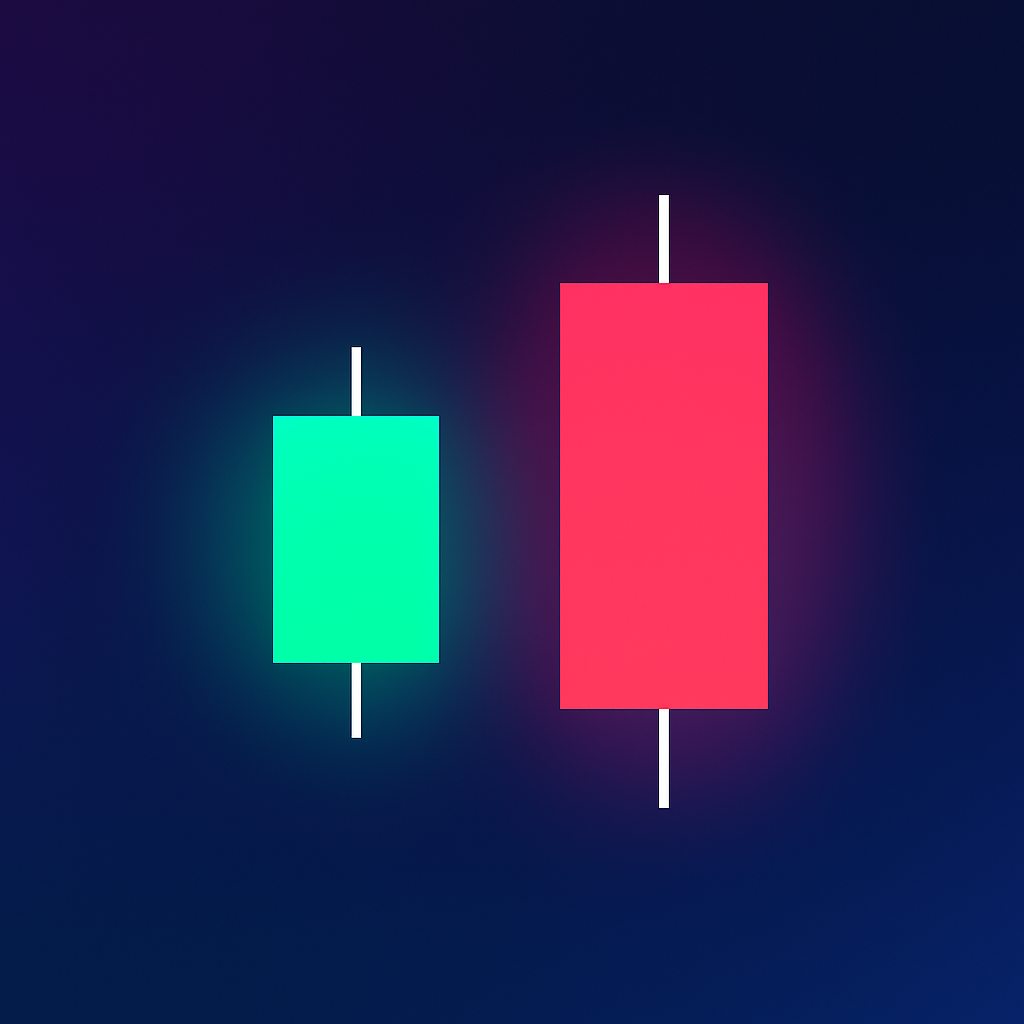
Each candlestick displays four critical pieces of information:
- Open
- Close
- High
- Low
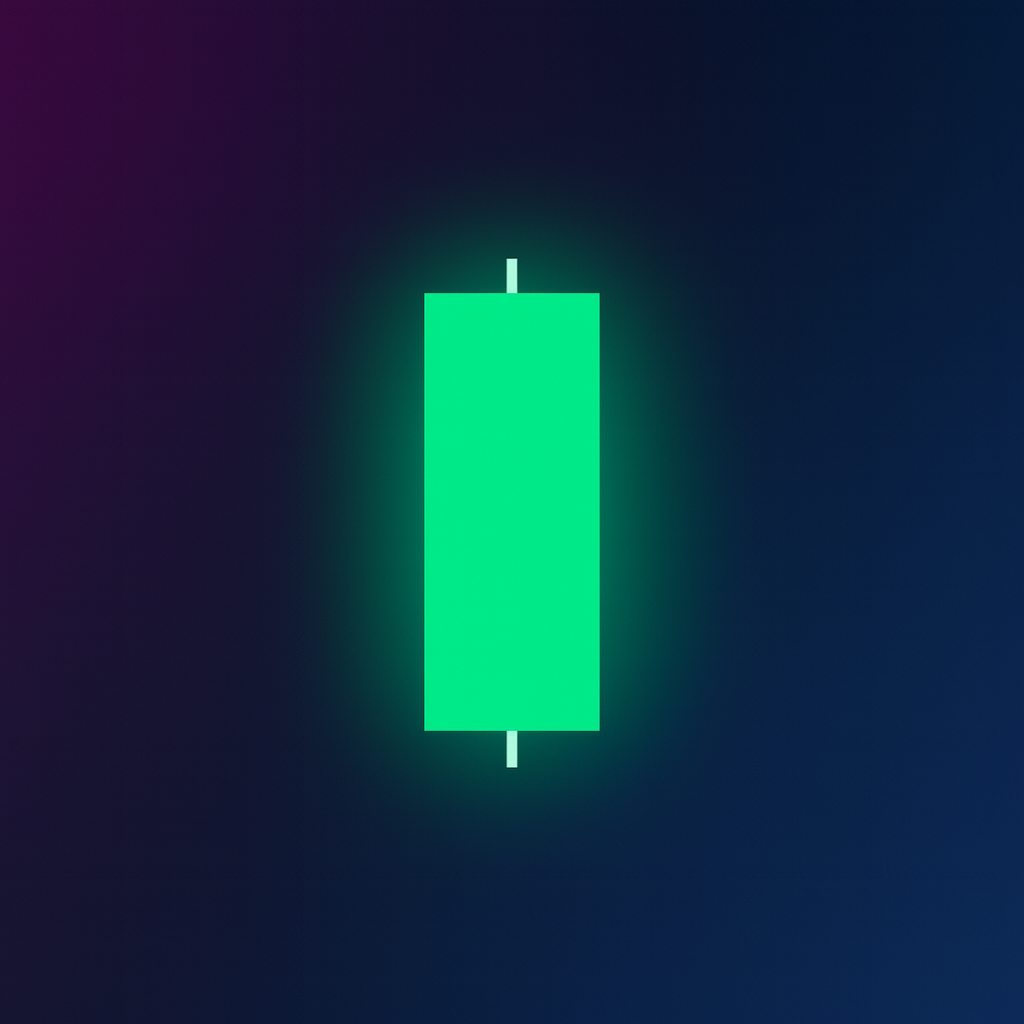
A bullish candle (usually green) indicates that price closed higher than it opened.
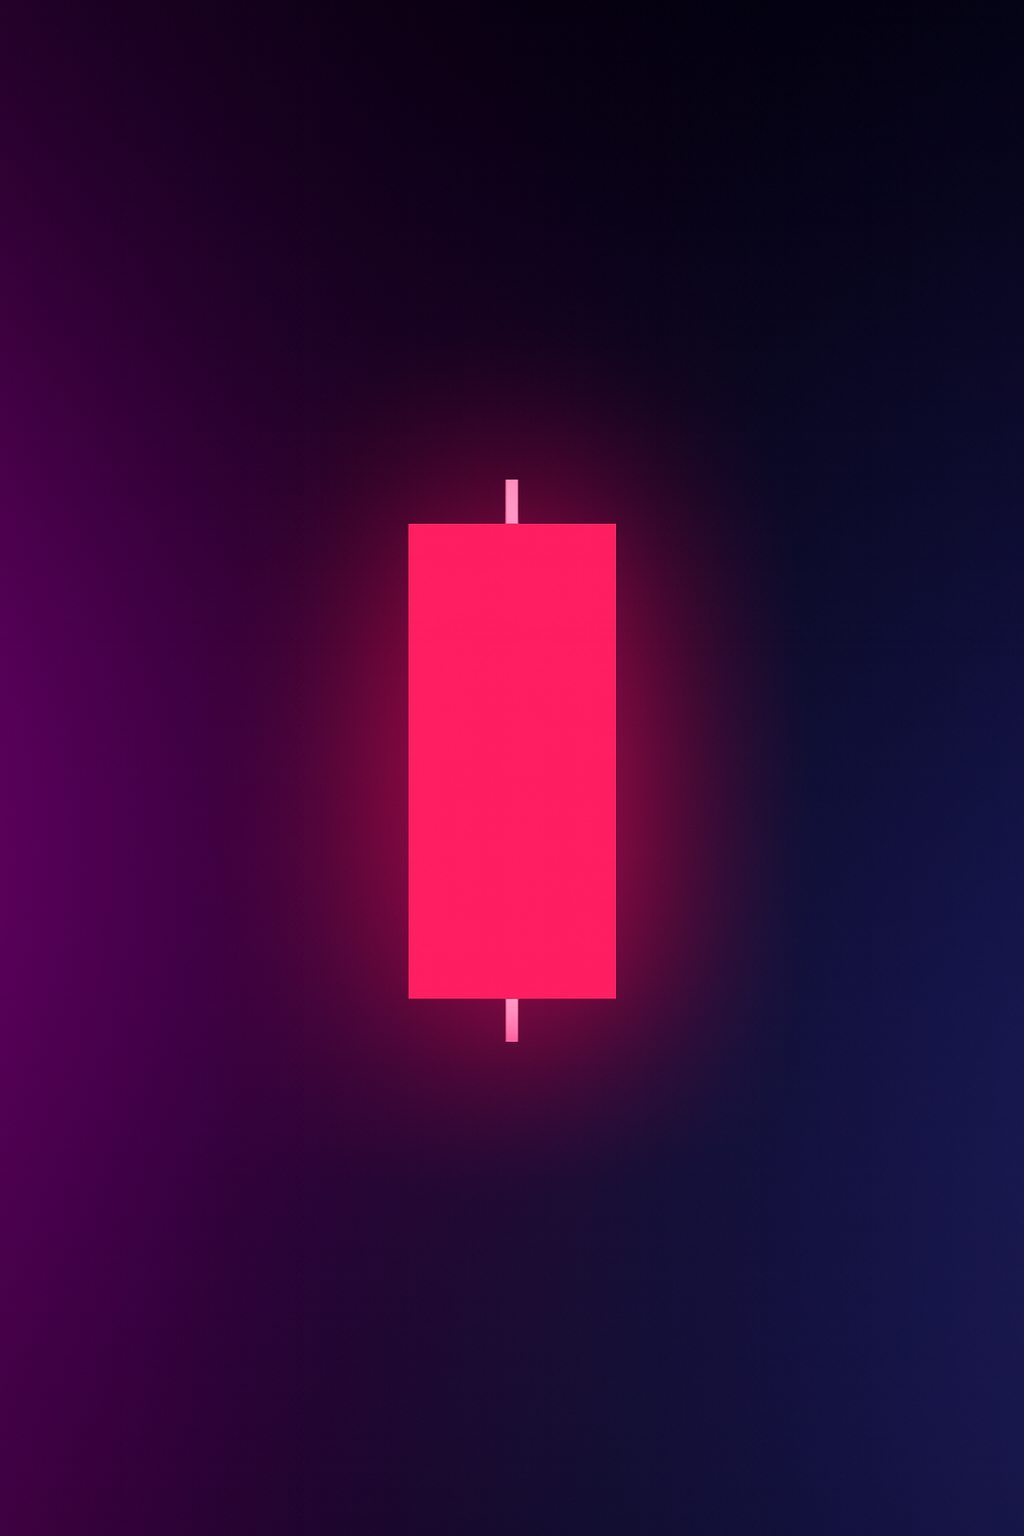
A bearish candle (usually red) indicates price closed lower than it opened.
Despite their simplicity, candlesticks reveal an enormous amount of trader behavior, such as:
- Who is in control: buyers or sellers
- Whether liquidity was swept
- Whether momentum is building or fading
- Where potential reversals or continuation patterns may form
For Quant Funded traders using structured risk management, candlesticks act as a confirmation tool—validating entry triggers, invalidation points, and market direction.
Why Candlestick Patterns Matter for Prop Firm Traders
Trading a prop firm challenge or funded account means:
- tight daily loss limits
- strict consistency requirements
- precise entries and exits
Candlestick patterns help traders stay aligned with market structure and avoid emotional or impulsive decisions.
Key advantages of using candlesticks in a funded account:
✔ Clarity
Candles instantly show who is winning the battle between buyers and sellers.
✔ Precision
They help refine entry timing inside liquidity zones, order blocks, or fair value gaps.
✔ Risk Control
Candlestick confirmation prevents premature entries and helps avoid weak trade setups.
✔ High-Quality Confluence
Pairing price action candles with “LTC” concepts (Liquidity Target Concepts) used by many Quant Funded traders increases accuracy and confidence.
Core Candlestick Patterns Every Quant Funded Trader Should Know
Below are the most important candlestick types, explained in simple, practical trading terms.
1. Long Day Bullish Candle
A long bullish candle features:
- A large body
- Small wicks
- Strong upward movement
What it means:
Buyers are fully in control. Liquidity was likely taken below, and price expanded.
Use as a Quant Funded trader:
This is not an entry signal alone, but strong confirmation that a bullish expansion is underway. Often appears:
- After liquidity sweeps
- At the beginning of a new trend
- During momentum continuation
2. Long Day Bearish Candle
A mirror image of the bullish version:
- Big bearish body
- Minimal wicks
- Strong selling pressure
Meaning:
Sellers are dominating. A bearish expansion is underway.
Use:
Helps validate bearish continuation or confirm a trend shift near key liquidity levels.
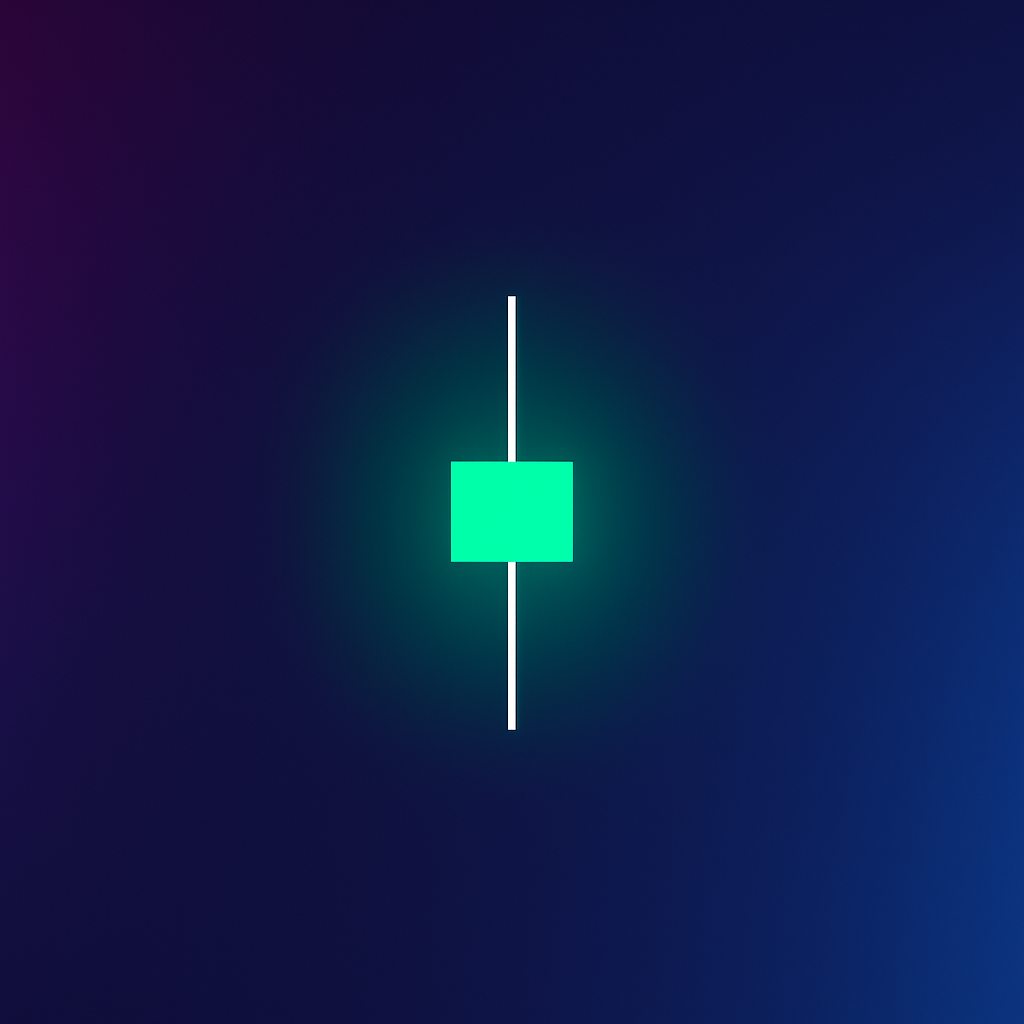
3. Short Day Candlestick (Bullish or Bearish)
A short day candle has a small body and limited movement.
Meaning:
The market is consolidating, absorbing orders, and preparing for expansion.
Trading insight:
This often precedes:
- Breakouts
- Trend reversals
- Large displacement candles
Be cautious: short day candles alone are indecisive and should be combined with structure.
The Marubozu Family: Power Candles
Marubozu candles are among the most powerful to interpret.
4. Bullish Marubozu
No wicks—just a full bullish body.
Meaning:
Complete buyer dominance.
Trading implications:
If found:
- In an uptrend: continuation likely
- In a downtrend: reversal probability increases
5. Bearish Marubozu
Full bearish body, no wick.
Meaning:
Seller dominance.
Use:
Great for identifying the start of strong sell-side momentum or confirming bearish continuation.
6. Bullish Closing Marubozu
A long bullish candle with a small lower wick.
Meaning:
Sellers tried to push price lower early, but buyers completely overpowered them.
Best location:
- Support zones
- Discount environments
- Market bottoms
7. Bearish Closing Marubozu
A bearish candle with a small top wick.
Meaning:
Buyers tried, but sellers crushed them.
Useful at:
- Premium zones
- Resistance levels
- Liquidity sweep tops
Reversal and Indecision Candles
These patterns are essential for spotting turning points—critical for challenge risk management.
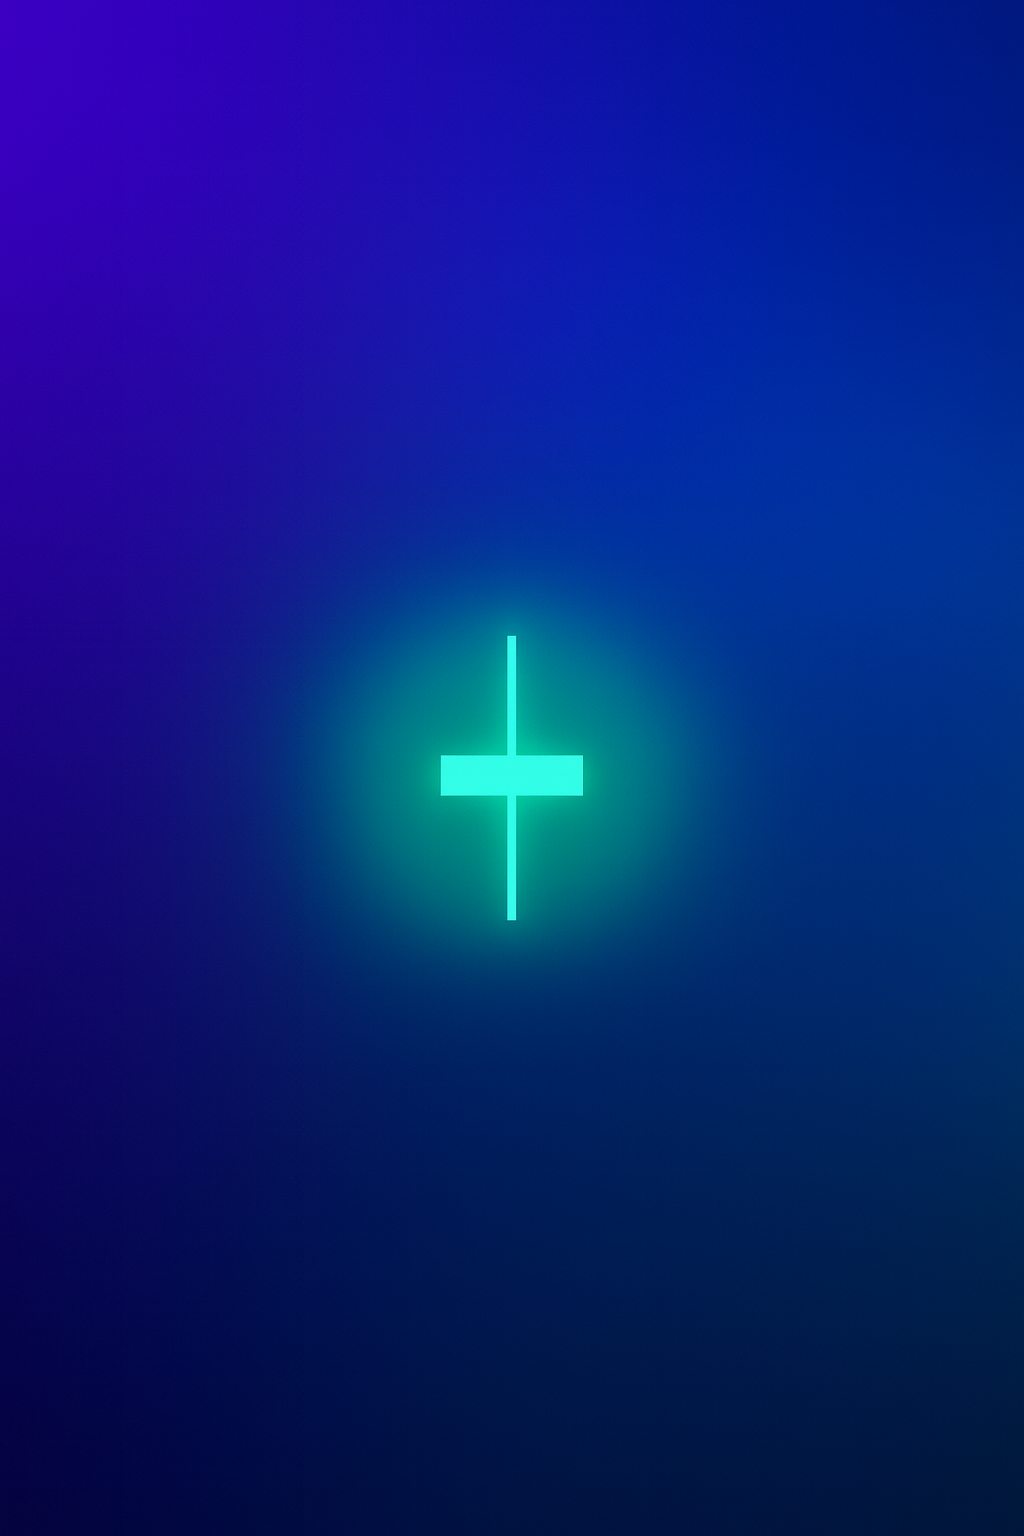
8. Spinning Top
Small body, long wicks.
Meaning:
Indecision. Neither buyers nor sellers dominate.
Interpretation:
At resistance → bearish reversal signal
At support → bullish reversal signal
9. The Doji
Open and close are nearly identical.
Doji indicates maximum indecision—often found at major turning points.
Three types:
✔ Long-Legged Doji
Extreme back-and-forth movement. High reversal probability.
✔ Gravestone Doji (Bearish)
Strong bearish rejection. Great at the top of a premium zone.
✔ Dragonfly Doji (Bullish)
Strong bullish rejection. Effective at bottoms or discount levels.
10. Engulfing Patterns (High-Probability Setups)
Bullish Engulfing
Small red candle → large green candle fully engulfing previous candle.
Meaning: Major shift from sell-side to buy-side liquidity.
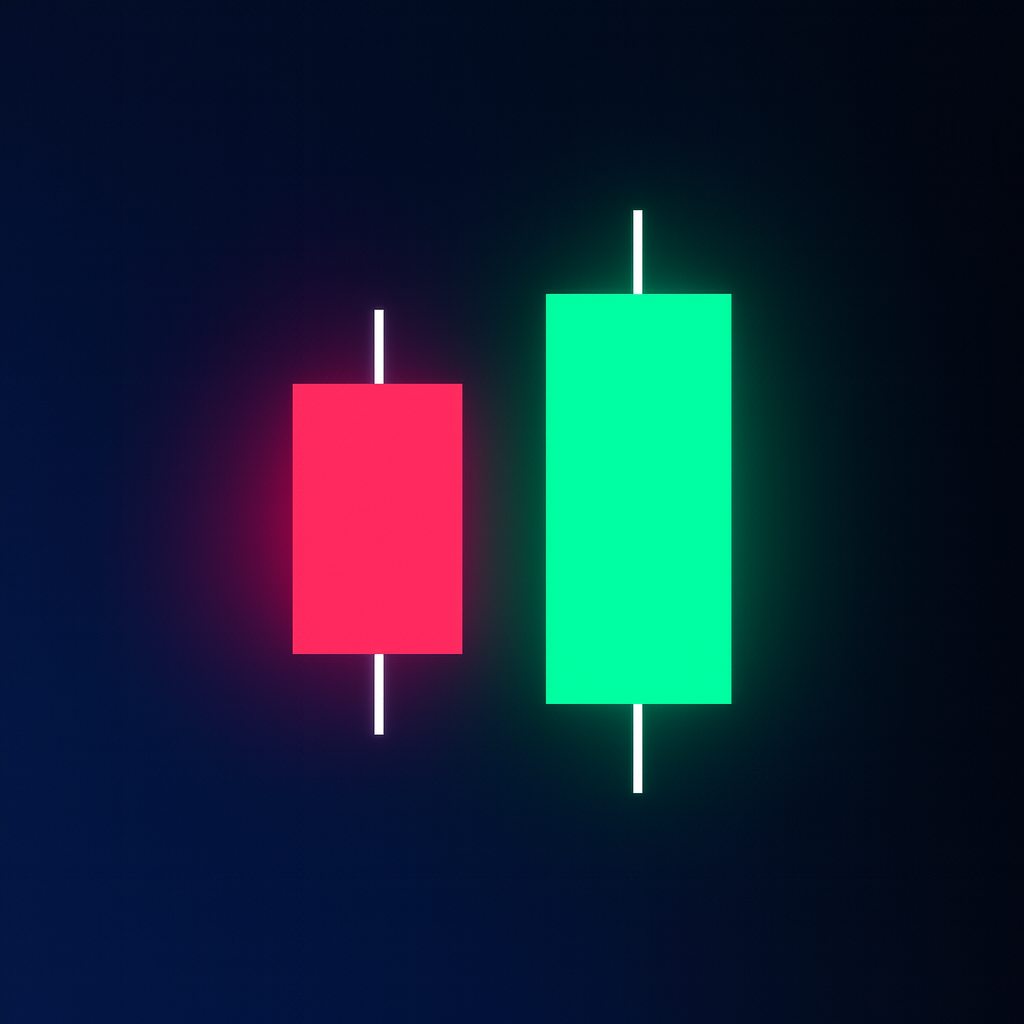
Bearish Engulfing
Small green candle → large red candle engulfing the previous candle.
Meaning: Powerful sell-side takeover.
Why engulfings are powerful:
They represent liquidity grabs followed by displacement—ideal for Quant Funded challenge traders who rely on clean market shifts.
How to Use Candlestick Patterns in a Prop Firm Trading Strategy
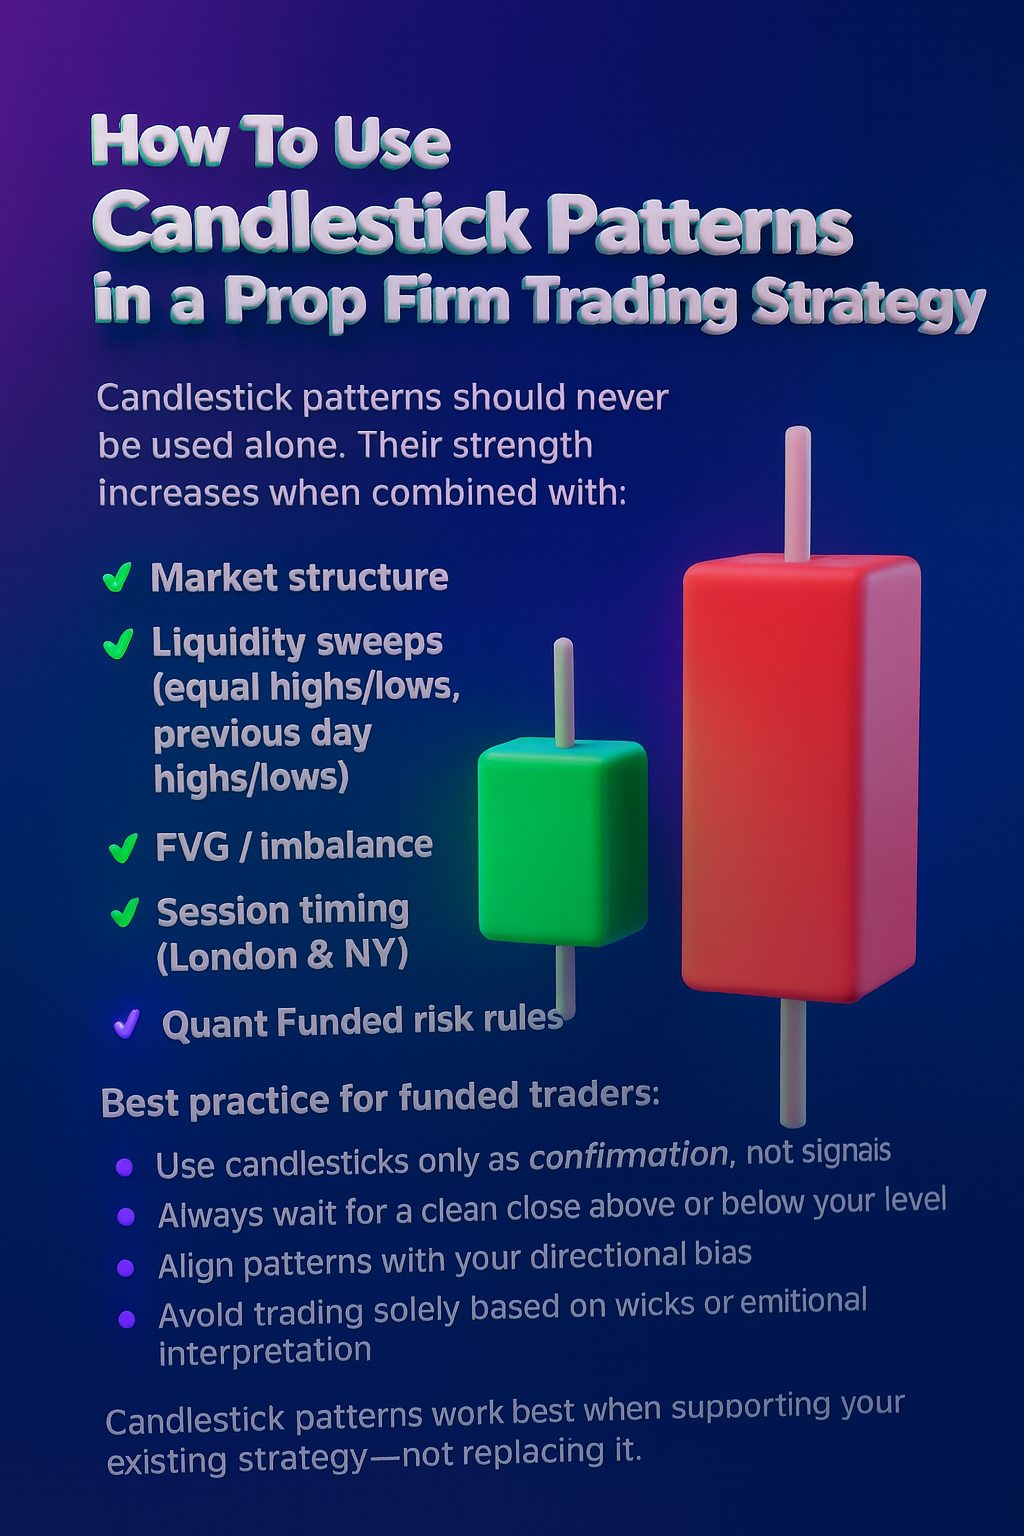
Candlestick patterns should never be used alone. Their strength increases when combined with:
✔ Market structure
✔ Liquidity sweeps (equal highs/lows, previous day highs/lows)
✔ FVG / imbalance
✔ Session timing (London & NY)
Best practice for funded traders:
- Use candlesticks only as confirmation, not signals
- Always wait for a clean close above or below your level
- Align patterns with your directional bias
- Avoid trading solely based on wicks or emotional interpretation
Candlestick patterns work best when supporting your existing strategy—not replacing it.
Final Thoughts: Master Candlesticks, Master Price Action
Japanese candlesticks remain one of the most powerful forms of price action analysis. For Quant Funded traders, understanding candlestick psychology can drastically improve:
- Entry precision
- Stop placement
- Trend confirmation
- Reversal identification
- Overall discipline
By combining candlestick patterns with liquidity concepts, session timing, and structured risk management, you position yourself as a consistently profitable funded trader.